No one wants bugs in their app. Developers, end users, product owners… everybody agree on this one. However I’m always surprised by the number of companies that don’t pay much attention to production bugs.
In this article I’ll try to explain how we handle bug monitoring at Drivy, the company I’m currently working for. Of course, it’s not perfect: we’ve iterated quite a bit over the years, and we’ll continue doing so. If you see improvements we can make, please leave a comment!
Detecting Bugs
The first step of fixing bugs is knowing that they exist. The worst kind of problems are the ones that goes undetected for a long time!
User Reports
If you only rely on user reports to find bugs, you’re going to have a bad time. However it’s important to keep an eye out for user reports.
At Drivy we have a team dedicated to customer support, but they handle all kind of calls. On some occasions there will be reports of problems, so we created a Slack channel called #ask-a-tech where they can tell the development team about possible bugs.

This is a simpler, lighter process than creating Jira or Fogbugz to discuss between departments and it allows us to be quicker to respond while getting more information from the person in contact with the user. We’re still a somewhat small team so it still scales well.
Of course we also worked on a frequently asked questions and known bugs section in our internal wiki:

Bugtracking Apps
More and more people use tools like Sentry, Rollbar or Bugsnag, to detect 500s. If you’re not using one, I highly encourage you to try it out. Most of them are very quick to setup and you’ll instantly get a better view over what’s going on in your app.
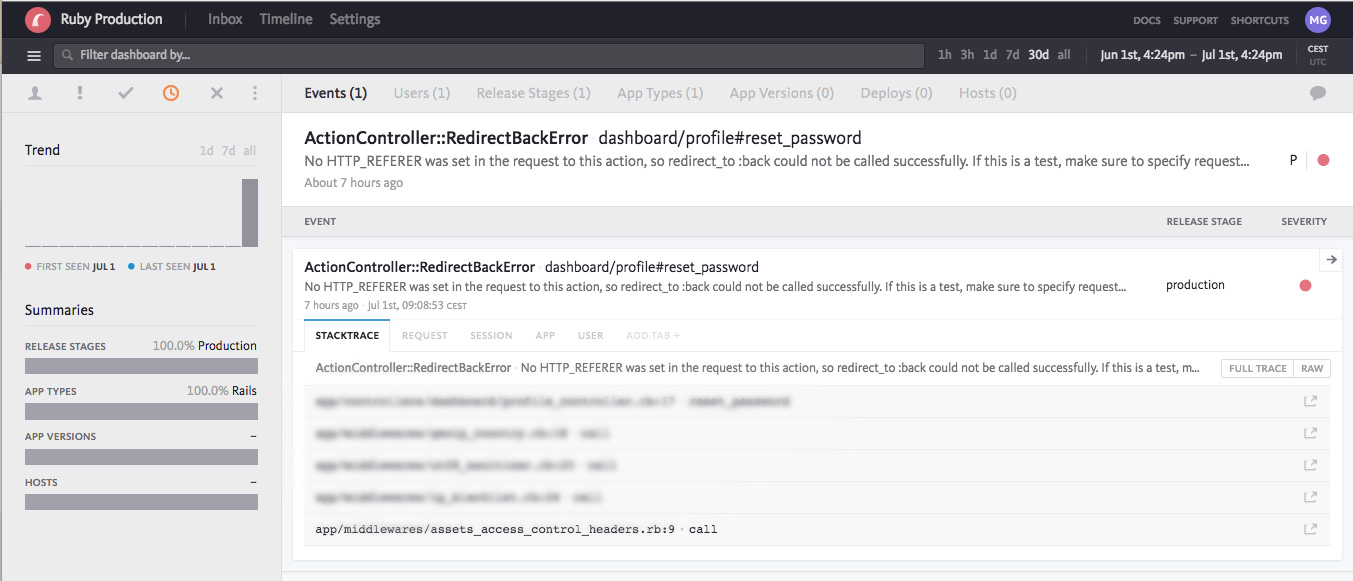
At Drivy we’ve been using Bugsnag and are quite happy with it. Before that we were using Exceptionnal (now Airbreak), but I really wouldn’t recommend it. I’ve also had a good experience with Sentry in the past.
Tracking Metrics
Sometimes a bug won’t simply cause a page to break, raising an easily catchable 500. Instead, they will drive away traffic over time, lower conversion, corrupt data or generally be an inconvenience to users.
These bugs are way harder to detect.
When possible, we try to get bugs to either crash or, at least, notify us. Still, we can never be sure we caught every edge cases. In order to be more confident, we monitor metrics that would be impacted by these problems. For instance if you have a bug in your Facebook login integration, you will see less successful users logging in from Facebook, but the site might not return a 500 on the login endpoint.
Universal Analytics
We use Universal Analytics for a lot of different things, including A/B tests and custom event monitoring. With custom alerts, we are alerted if some important business KPIs go under a certain level that indicate a bug.
re:dash
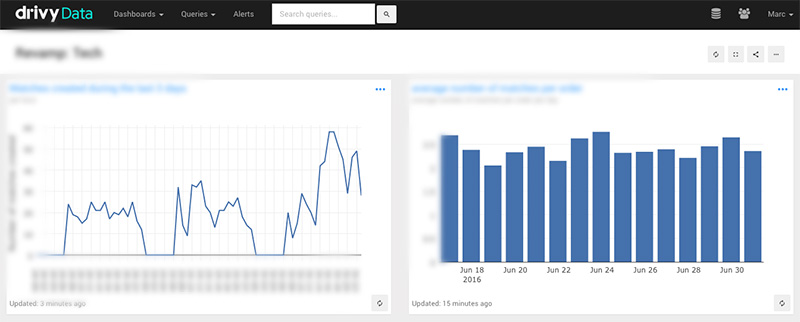
We also use re:dash to easily pull data from our replica database and create dashboards. This is used mainly for business KPIs, but it can also be used to build graphs used by developers in order to monitor a particular part of the app.
For instance if the volume of a certain event changes or takes a new pattern, it can be detected at a glance.
Tracking Logs With Logmatic
In the past year we went from Logentries to Logmatic and never looked back. Not only it is a great tool to debug production issues, but it is also allows us to create very detailed dashboards based on logs.
For instance we use it to track how much time a given Sidekiq job takes. This, in addition to their alerts feature allows us to make sure there isn’t some weird performance issue sneaking into a job.
Time Based Metrics
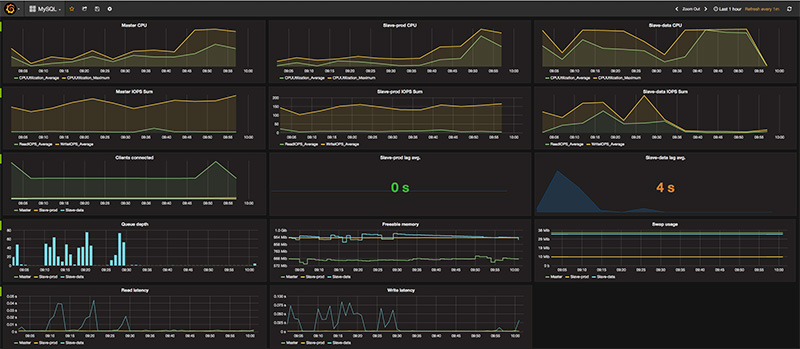
We’re getting more and more into unifying time based dashboards with Telegraf, Influxdb and Grafana. This way it reduces the number of dashboards one has to look at.
Custom Jobs
In some cases monitoring outside the app is impossible or too costly. To still be certain that there are no bugs there, we also write custom jobs to check asynchronously if certain pieces of the app are behaving correctly and send us notifications if they don’t.
Performance Monitoring
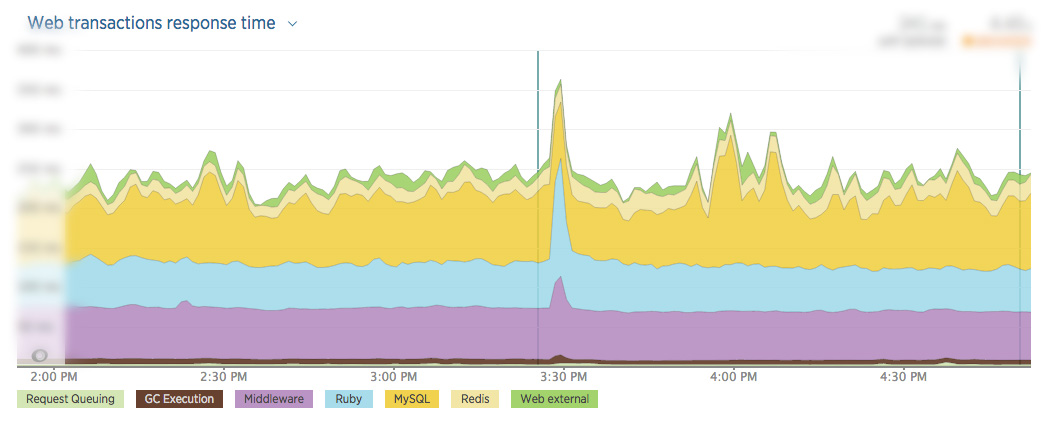
I won’t get too much into general performance monitoring, because it’s another subject altogether. To sum it up, we use New Relic and the usual tracking related to our stack on AWS.
Monitoring Bugs
Having nice dashboards and robust tracking is one thing, but if you don’t look at them they’re pretty much worthless. On the other hand if you have too much information it becomes noise. You also have to make decisions regarding how much monitoring you want to be doing versus building new things.
AlertsUsually
PagerDuty
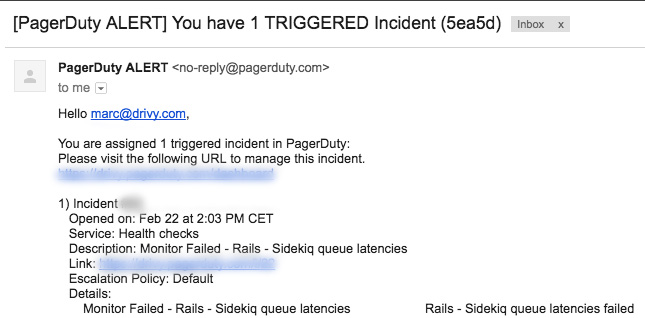
When possible, we try to be notified by the various apps. We use PagerDuty when possible. This way we can react as fast as possible when there is a real production breaking problem.
Others
A lot of the services I mentioned do send alerts, including Logmatic, New Relic, Cloudwatch and so on. Here it’s really a matter of fine tuning the thresholds to make sure the notifications sent are real issues and not noise.
Reacting To A Production Breaking Bug
If there is a problem so huge that the site is either down or severely degraded, we’ll be notified via PagerDuty and the person in charge at this point will take action and report everything that is going on in our #war-room Slack channel. This way everyone is kept in the loop.
Thankfully it doesn’t happen often.
Dealing With 500s: The Bugmaster
In 99.99% of the cases the 500s occurring on the site are isolated issues that, while annoying, only impact a reduced amount of users and don’t bring the site to a stop.
However, until someone looks at what is happening, we don’t really know what is going on.
This is why every week a developer is in charge of making sure that every crash on the website has been properly investigated. We call this person “the bugmaster”, and almost everyone in the team is in the rotation to take this role. To decide who is going to be the bugmaster for a given week, we built a simple script in a shared Google spreadhseet that sends an email to the team.
When a 500 appears, it is sent to Bugsnag. The bugmaster then needs to check it out and decide what to do. They can spend a few minutes trying to reproduce the bug or discover the section of the codebase impacted.
Then they can either take care of the bug themselves or assign it to someone else that knows more about it. To do this, Bugsnag has a convenient assignation feature and various filters to see every errors associated to you. We also built a bot to send reminders to the bugmaster for as long as the bug is unassigned.

Once a bug has been assigned to a developer, they can either:
- Fix it right away
- Create a Github issue to fix it later on
- Re-assign it to someone
- Send it back to the bugmaster if they don’t have any time to work on it right now
While the bug is assigned to them and no action have been made, the developer will get Slack reminders.

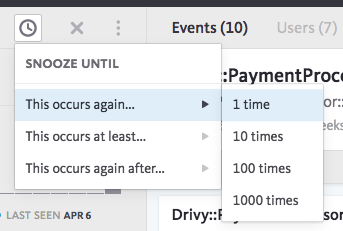
If they decide to fix it later, they can “snooze” the bug. Snoozing means that they are going to be notified once an exception occurred again a given number of times (1, 10, 100 or 1000). It doesn’t mean that we fixed or decided to ignore the exception, but instead that we want to be aware of the frequency of this particular problem.
The important thing here is that once a bug appears we make sure someone is aware of it and took some actions to make sure it’s under control.
Because of this objective of triaging every crash in the product app, the bugmaster’s objective is to always be at inbox zero on bugs.
Note On Not Reacting Right Away
This might sound counter intuitive: if there is a bug, why not spend time right away to fix it?
Well, firstly, we do not “snooze” every single exception without giving it some thought first. The decision to do this is a matter of criticality and focus. Any complex production site with enough traffic is going to raises 500s, it’s pretty much inevitable. However these exceptions are not equal and it’s up to a developer to decide what to do.
Here are some examples where we think that snoozing can be appropriate:
-
Very weird exception happening for the first time on a non critical page. e.g.: UTF8 Encoding error from a bot on a SEO page
-
There was a deploy and a race condition occurred. e.g.: Missing attribute ‘name’ because a migration was still running
-
There is a known issue that is considered hard or time consuming to fix. Everybody knows about it and we’re going to get to it eventually.
Fixing Bugs
Now for the fun part! I’m not going to go too much in depth here however, but it might be the subject of another blog post.
Shipping Quickly
If you reduce the cost of shipping code to production, you’ll do it more often and it’ll be easy to ship bug fixes and make users happy.
For instance at Drivy we worked a lot on our deployment pipeline and nowadays we use a command line tool to release. Of course since we love Slack, everything is plugged into it:

In general, I recommend to read “How to deploy software: Make your team’s deploys as boring as hell and stop stressing about it” by Zach Holman.
Preventing Regressions
Once a bugfix has been made, it’s important to make sure it doesn’t happen again in slightly different circumstances. This is why every piece of code fixing a bug is usually paired with a few automated tests.
Avoiding Bugs
Of course the best way to handle bugs is to not have them in the first place!
To do so we have a lot of automated tests running on a CI server, small and very frequent deployments, code reviews, emphasis on code quality, an efficient yet simple Git flow, feature flags… as well as a team of people that want to ship code with as little bugs as possible.
Overall I feel like the way we do things has evolved a lot over the years, but it is quite robust and it’s very rare when we are caught off guard by a serious bug. This gives an overall better end user experience, but it is also great to work on a project that feels stable and under control.
Since you scrolled this far, you might be interested in some other things I wrote: